


Power BI : Sparklines (Generally Available)
- Jun 27, 2025
- 3 min read
Updated: Sep 5, 2025
Sparklines – the tiny, powerful line charts inside table or matrix visuals are now generally available in Power BI! You can now control how calculation groups interact with sparklines, a game changer for dynamic analysis.
What are sparklines?
Sparklines are miniature charts within a table cell. They’re most often used to show trends over time and make it easy to spot patterns quickly.
You can now choose how a calculation group affects your sparklines:
Option | Description |
Individual Values | Applies the calculation group to each point in the sparkline |
Entire Sparkline | Applies the calculation group to the aggregate value across the entire series |
An example of this in practice is a measure that calculates the Sum of Gross Sales by totaling the Gross Sales.
Sum of Gross Sales = SUM(financials[Gross Sales])A measure called IsBigSales has been added, which compares the Sum of Gross Sales against a BigSalesSize cutoff value set to 1,000,000 using a field parameter.
IsBigSales = IF(‘financials’[Sum of Gross Sales] >= BigSalesSize[BigSalesSize Value], TRUE, FALSE)A calculation group was added that contains three calculations items:
Calculation Group Setup
Name | Dax Expression | Description |
Actual | SELECTEDMEASURE() | Show actual value always |
Actual For Big Sales Only | IF([IsBigSales],SELECTEDMEASURE(), BLANK()) | Show values only where sales exceed the cutoff |
% of Grand Total | DIVIDE(SELECTEDMEASURE(),CALCULATE(SELECTEDMEASURE(),ALLSELECTED())) | Show share of total sales |
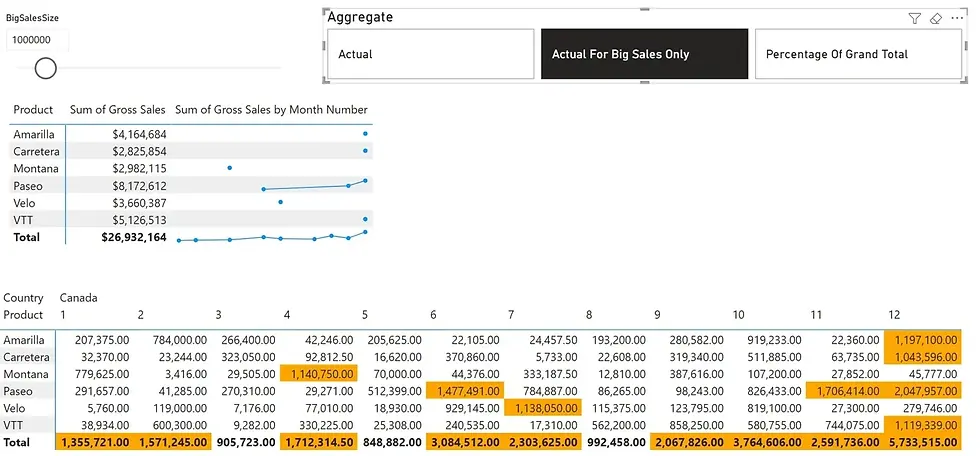
A matrix was created to display the sum of gross sales by product. Additionally, a sparkline was added to illustrate the sum of gross sales by month.

The sparkline that shows Sum of Gross Sales by Month Number is set to the default behavior of applying the sparkline to individual values.

When the calculation group is switched to ‘Actual for Big Sales Only’ using the slicer, the sparkline evaluates each individual data point—typically, sales per month. This means that only the months and product combinations where the Gross Sales exceed the 1,000,000 BigSalesSize threshold will be displayed in the sparkline.
To make this behavior more intuitive, a supporting matrix has been included. It shows Gross Sales broken down by Month and Product, with conditional formatting applied to highlight the values above the cutoff. These highlighted cells directly correspond to the visible data points in the sparkline, making it easier to interpret which values qualify as “big sales.”
Let’s change the sparkline setting to apply the calculation group to the entire sparkline. In this mode, the calculation evaluates the total Gross Sales across all months-ignoring the X-axis. As a result, all sparklines are initially displayed, because each product’s total sales exceed the default cutoff value.
However, when we increase the BigSalesSize cutoff to 3,000,000 products that no longer meet this threshold will have their sparklines hidden. To help visualize this, a matrix with conditional formatting has been added below, clearly showing which products still exceed the new cutoff and which do not.

Carretera and Montana do not meet the cutoff, so their sparklines are not displayed, while others appear as expected.
‘Show items with no data’ is enabled to keep these products visible, even when the sparkline returns BLANK().
It’s essential to note that arithmetic operations within calculation group items (such as DIVIDE()) are not supported when a sparkline is set to ‘Apply to entire sparkline’.
To demonstrate this, we switch the calculation group to ‘Percentage of Grand Total’, which performs a division across selected measures. As expected, the visual produces an error message, prompting the user to change the sparkline setting back to ‘Individual values’ in order to render it correctly.
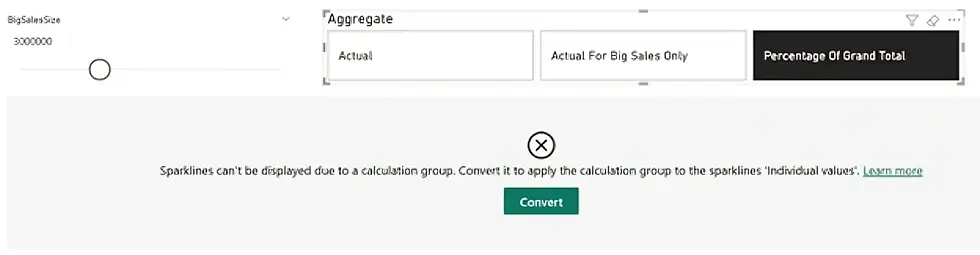
Pressing Convert or setting the sparkline to ‘Individual values’ again will make the visual show again:

Conclusion
By combining sparklines with calculation groups, Power BI empowers you to deliver more dynamic, context-aware insights—whether you're highlighting monthly trends or filtering by performance thresholds. Just remember to choose the right application mode and watch out for limitations with arithmetic-based calculations. Smart visuals, smarter decisions!


Comments